
I know some folks who would like to move to GitHub Actions from Azure DevOps, but would really miss the “Test View” that Azure DevOps provides. Let’s see if we can work some magic with GitHub Actions to get us close to that within GitHub.
Goals
- Work entirely within GitHub Actions
- Show test results within a pull request
- Show difference in number of tests
- When tests fail, be able to quickly see which tests failed, and the failure/trace
- Understand test coverage
Sample Project
I’ve created a sample project that uses these techniques at https://github.com/SeanKilleen/ExampleTestResultsWithGithubActions. Feel free to submit a pull request to see it in action!
Project Structure
For the sample, I created a basic project structure that you might find in the wild:
ExampleTestResultsWithGithubActions.sln
src
  /Project1
  /Project2
test
  /Project1.Tests
  /Project2.Tests
Creating the GitHub Action for our Build
I create a file at .github/workflows/build.yaml. You can view the full file contents but I’ll break down the relevant portions below.
Enabling Permissions
Some of these steps need to write pull requests comments, etc. so in the job definition I include permissions: write-all. I probably could get away with less permissions, but for this example I’m living dangerously.
Setup and Running our Tests
First, I check out the code and set up .NET:
- name: Check out the code
  uses: actions/checkout@v4
  with:
    fetch-depth: 0
- name: Setup .NET
  uses: actions/setup-dotnet@v4
  with:
    dotnet-version: |
      8.x
Next, we run our tests:
- name: "Restore/Build/Test"
  run: dotnet test --configuration Release --verbosity normal --logger trx --collect:"XPlat Code Coverage"
A few things to note here:
- We’re specifically logging to TRX files, which will make our reporting easier later
-
--collect: "XPlat Code Coverage"is a signal to Coverlet for the type of output it’s going to produce. - The projects themselves have the NUnit packages installed but also the
Coverlet.CollectorNuGet package.
Reporting Code Coverage
First, we combine our coverage reports. This is because each project has its own coverage output, so we need to combine them.
- name: Combine Coverage Reports # This is because one report is produced per project, and we want one result for all of them.
  uses: danielpalme/[email protected]
  with:
    reports: "**/*.cobertura.xml" # REQUIRED # The coverage reports that should be parsed (separated by semicolon). Globbing is supported.
    targetdir: "${{ github.workspace }}" # REQUIRED # The directory where the generated report should be saved.
    reporttypes: "Cobertura" # The output formats and scope (separated by semicolon) Values: Badges, Clover, Cobertura, CsvSummary, Html, Html_Dark, Html_Light, Html_BlueRed, HtmlChart, HtmlInline, HtmlInline_AzurePipelines, HtmlInline_AzurePipelines_Dark, HtmlInline_AzurePipelines_Light, HtmlSummary, JsonSummary, Latex, LatexSummary, lcov, MarkdownSummary, MarkdownSummaryGithub, MarkdownDeltaSummary, MHtml, PngChart, SonarQube, TeamCitySummary, TextSummary, TextDeltaSummary, Xml, XmlSummary
    verbosity: "Info" # The verbosity level of the log messages. Values: Verbose, Info, Warning, Error, Off
    title: "Code Coverage" # Optional title.
    tag: "${{ github.run_number }}_${{ github.run_id }}" # Optional tag or build version.
    customSettings: "" # Optional custom settings (separated by semicolon). See: https://github.com/danielpalme/ReportGenerator/wiki/Settings.
    toolpath: "reportgeneratortool" # Default directory for installing the dotnet tool.
I then choose to upload the combined coverage report to our build’s artifacts:
- name: Upload Combined Coverage XML
  uses: actions/upload-artifact@v4
  with:
    name: coverage
    path: ${{ github.workspace }}/Cobertura.xml
    retention-days: 5
Next up, we publish the coverage report – this takes the Cobertura.xml file and turns it into code-coverage-results.md, a nice Markdown file.
- name: Publish Code Coverage Report
  uses: irongut/[email protected]
  with:
    filename: "Cobertura.xml"
    badge: true
    fail_below_min: false # just informative for now
    format: markdown
    hide_branch_rate: false
    hide_complexity: false
    indicators: true
    output: both
    thresholds: "10 30"
A few things to note here:
- We can choose to fail the build if it falls below a minimum threshold. I set this to
falsesince the purpose of this demo is just informative. - We can set the thresholds for failure and warning. Here, they are 10% and 30% respectively.
- I set
indicatorsto true to show markdown emoji indicators for easier visuals.
Lastly, I surface the code coverage statistics in a PR comment:
- name: Add Coverage PR Comment
  uses: marocchino/sticky-pull-request-comment@v2
  if: github.event_name == 'pull_request'
  with:
    recreate: true
    path: code-coverage-results.md
Reporting on Test Outcomes
Coverage is one thing, but knowing whether our tests have passed or failed is the key. We don’t just want to see a failed build, we want a test summary, and we want to be able to go directly to any failing tests.
I choose to upload the test results to my build’s artifacts:
- name: Upload Test Result Files
  uses: actions/upload-artifact@v4
  with:
    name: test-results
    path: ${{ github.workspace }}/**/TestResults/**/*
    retention-days: 5
And then I use another great GitHub Action to publish those results:
- name: Publish Test Results
  uses: EnricoMi/[email protected]
  if: always()
  with:
    trx_files: "${{ github.workspace }}/**/*.trx"
Notes:
- I specify the TRX files that we previously set our
dotnet testto produce in our earlier action - The
if: always()ensures that this step will run even if prior steps fail. This is key, because if my tests fail, the build will fail, but I still want to produce this report so that I’ll know what failed.
Let’s See the Results!
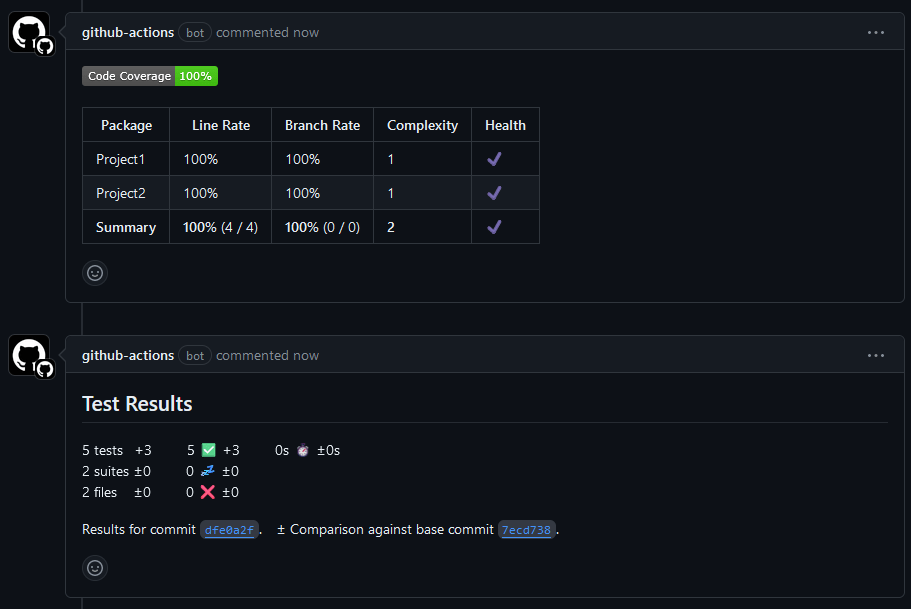
In a PR where I add a test, I see the results and the coverage report in GitHub comments. The coverage report doesn’t show a change, because it was already at 100% previously, but I do see 3 additional test cases, the total number of test cases, and what the current coverage is.
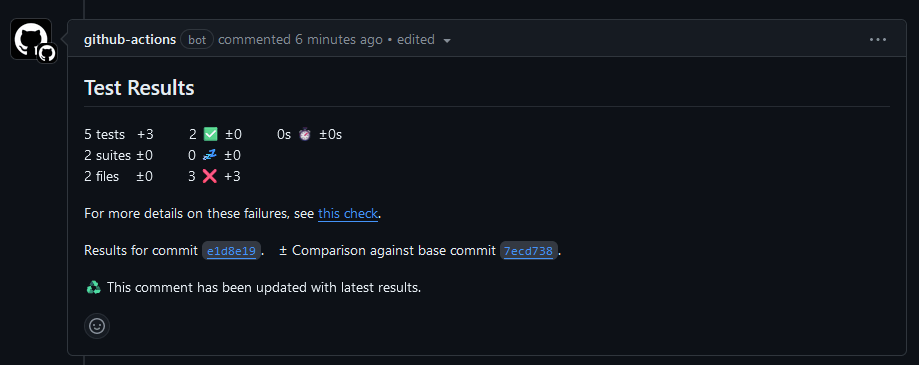
Let’s try with a failed test. If I take those same passing tests from above and mess them up and push the changes to the pull request, then I see the indicator in the PR comment:
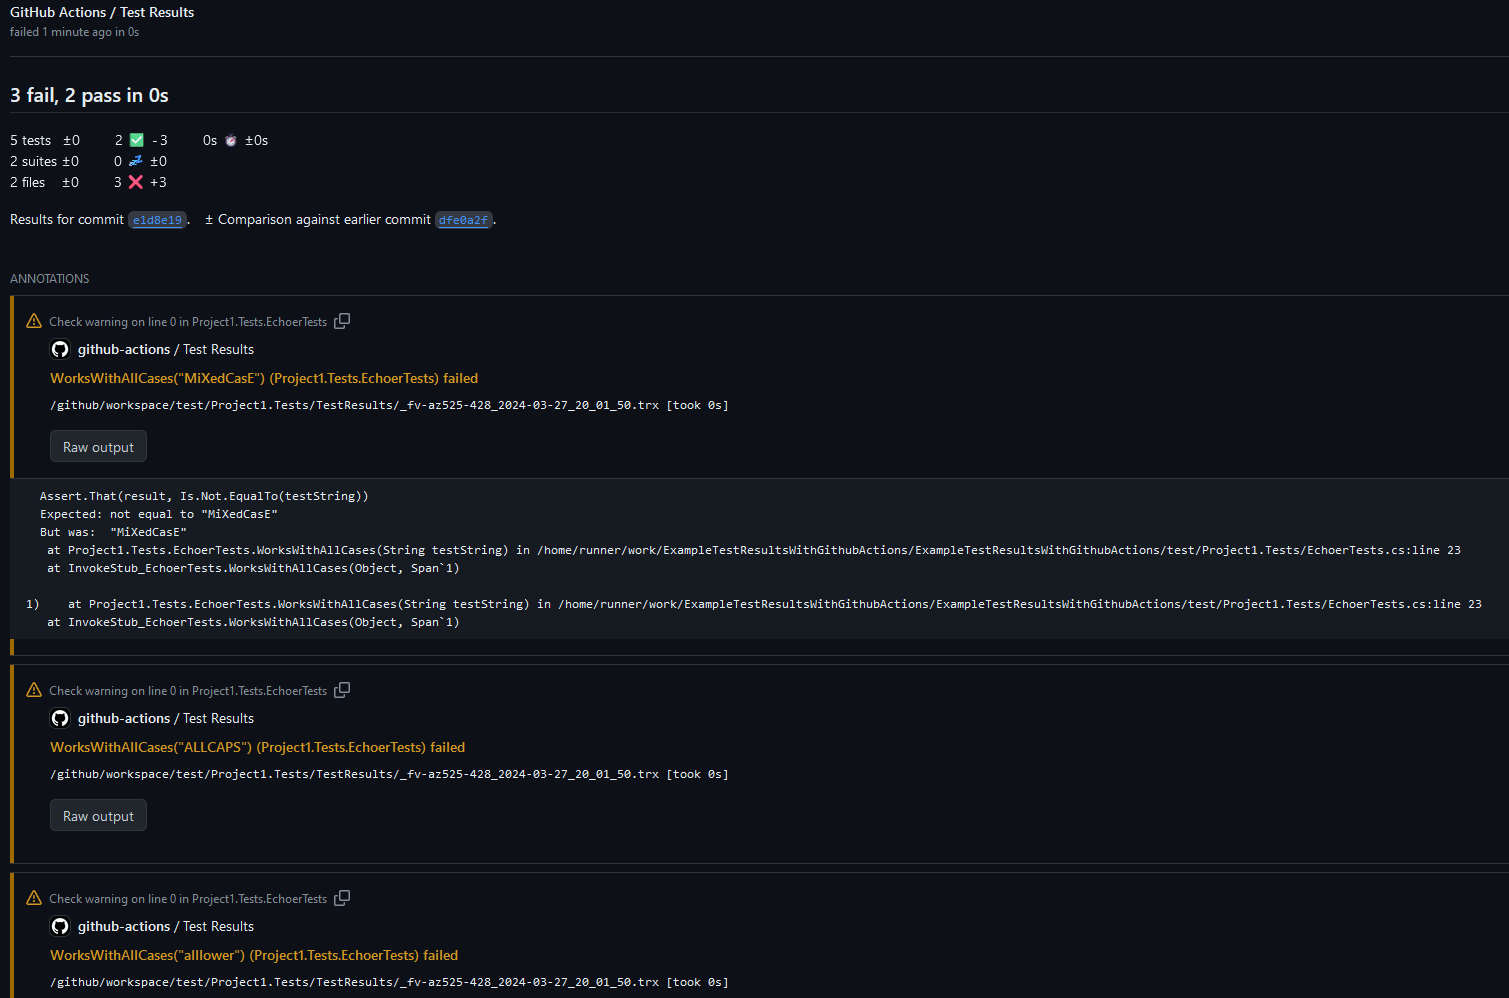
When I can click into the link in the comment for more details, I see a great screen that shows me which tests failed, and includes the failed assertion text and the location in the code.
So, Have We Accomplished Our Goals?
-
 Work entirely within GitHub Actions
 -
Show test results within a pull request
-
Show difference in number of tests
-
When tests fail, be able to quickly see which tests failed, and the failure/trace
-
Understand test coverage
Voila!
Roll the Credits
I am continually amazed at what can be accomplished by GitHub Actions thanks to creative and talented people who have chosen to share with the community. A reminder that I didn’t use a single custom piece of code in this example; it was all GitHub Actions provided by others. That blows my mind.
- ReportGenerator-GitHub-Action by Daniel Palme allows us to combine our coverage reports into a lovely Cobertura report file.
- CodeCoverageSummary by irongut generates the great markdown from our coverage files
-
sticky-pull-request-comment by GitHub user
@marocchinoallows us to hand-roll our own comment from Markdown - The phenomenal publish-unit-test-result-action by Enrico Minack puts our test results into an easily accessible format within GitHub.
All of these authors deserve our respect, appreciation, and sponsorship.
I’d Love Your Thoughts!
How are you currently accomplishing this within GitHub Actions?
Until next time – happy building!
Leave a comment